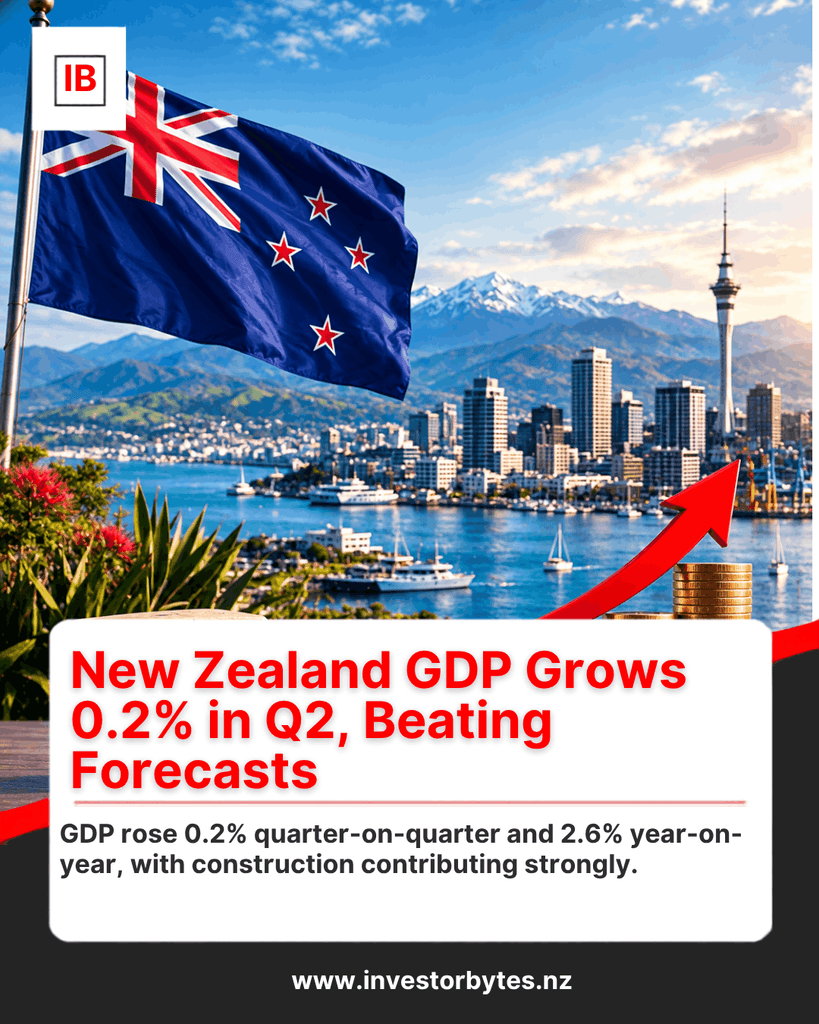
New Zealand GDP Growth reached 0.2% in Q2 2026, beating forecasts, while annual growth rose 2.6% and construction led the expansion.
New Zealand GDP Growth Beats Forecasts in Q2 2026
New Zealand GDP Growth increased by 0.2% quarter-on-quarter in the June 2026 quarter, beating market expectations of 0.1% and the Reserve Bank of New Zealand’s earlier expectation of no growth. Annual GDP growth reached 2.6%, compared with market expectations of 2.2%.
The result shows continued expansion in the New Zealand economy, although growth was slower than in the previous quarter. Construction was the strongest contributor, while some transport and logistics-related industries weakened.
5 Key Changes Behind New Zealand GDP Growth
1. GDP Expands 0.2% in the June Quarter
New Zealand’s economy grew 0.2% during Q2 2026, following stronger growth in the March quarter.
The quarterly result exceeded both the market forecast of 0.1% and the RBNZ’s expectation of zero growth. On an annual basis, GDP was 2.6% higher than a year earlier.
The figures indicate that economic activity continued to expand despite uncertainty surrounding global energy prices and geopolitical developments.
2. Construction Leads the Economic Expansion
Construction was the largest positive contributor to New Zealand GDP Growth, increasing 2.7% during the quarter.
The sector’s performance was particularly significant because construction activity had previously experienced weakness. The increase helped offset declines in several other industries and provided a major contribution to overall GDP.
Construction activity is also closely connected with residential and commercial investment, making its performance an important indicator for broader domestic economic conditions.
3. Only 9 of 16 Industries Recorded Growth
The overall GDP increase masks significant differences between industries.
Statistics NZ data showed that 9 of the 16 industries recorded growth during the quarter. Construction was the largest upward contributor, while transport, postal and warehousing provided the largest downward contribution.
This mixed performance means that the economic recovery is not evenly distributed across all sectors.
4. Annual Growth Reaches 2.6%
The economy’s annual growth rate increased to 2.6%, significantly above the market expectation of 2.2%.
The annual figure provides a broader view of economic activity than the quarterly result and indicates that total production was higher than during the same period of the previous year.
For businesses and investors, the annual growth figure is relevant because it provides additional context for assessing demand, corporate activity and economic momentum.
5. RBNZ Continues to Watch Inflation and Growth
The GDP figures come shortly after the RBNZ raised the Official Cash Rate to 2.75% by 25 basis points.
The central bank said inflation had reached 4.1% in the June quarter, largely because of higher fuel prices linked to the Middle East conflict. At the same time, the RBNZ said the economic recovery was expected to strengthen, although it remained uneven.
The stronger-than-expected GDP result therefore provides another important economic indicator for future monetary-policy decisions, although the RBNZ has emphasized that future decisions will depend on the balance of inflation and growth risks.
What New Zealand GDP Growth Means for Businesses
The latest New Zealand GDP Growth figures provide evidence that economic activity continued to expand during the June quarter.
Stronger construction activity could support businesses connected to building, materials, engineering and related services. However, weaker performance in transport and other sectors shows that economic conditions remain uneven.
Higher fuel prices also remain an important risk because they can increase transportation and operating costs for businesses.
Impact on Investors
For investors, the GDP figures provide an important snapshot of New Zealand’s economic conditions.
The combination of positive quarterly growth and 2.6% annual growth could influence expectations for corporate earnings, interest rates, the New Zealand dollar and domestic demand.
However, GDP growth alone does not determine market performance. Investors also need to consider inflation, interest rates, employment, commodity prices, global trade conditions and currency movements.
Inflation Remains a Key Economic Factor
While GDP expanded, inflation remains above the RBNZ’s 1–3% target range.
The central bank reported annual CPI inflation of 4.1% in June, with fuel prices making a significant contribution. Excluding vehicle fuels, annual inflation was 2.9%.
This creates a challenging environment for policymakers because economic growth needs to continue while inflationary pressures are brought back toward the target.
Key Takeaways
- New Zealand GDP Growth increased 0.2% quarter-on-quarter in Q2 2026.
- Annual GDP growth reached 2.6%.
- The result beat the market forecast of 0.1%.
- Construction grew 2.7% and was the largest upward contributor.
- 9 of 16 industries recorded growth.
- Transport, postal and warehousing were the largest downward contributors.
- Inflation remained elevated at 4.1% in June.
- The RBNZ’s OCR currently stands at 2.75%.
Conclusion
The latest New Zealand GDP Growth figures show that the economy expanded during the June 2026 quarter despite a challenging global environment. Growth of 0.2% exceeded forecasts, while annual expansion reached 2.6%.
Construction provided the strongest contribution, but the performance across industries remained mixed. For investors and businesses, the next important indicators will include inflation, employment, interest rates, consumer spending and export performance.
The RBNZ will continue to balance economic recovery against persistent inflation and higher fuel-related costs as it assesses future monetary policy.